CONTINUOUS IMPROVEMENT SOFTWARE FOR MANUFACTURING
From shopfloor problem
to verified savings.
Replace scattered Excel files, workshop decks and disconnected KPIs with one project record for root causes, actions, OEE or ROI and reusable standards.
Built for Lean, CI and OpEx teams in manufacturing.One project record
See the path from problem to value before the first workshop ends.
Operational systems record production and transactions. Leanyx keeps the improvement logic around them connected: evidence, root cause, action, KPI effect and the resulting standard.
Open the full project viewCASE 014 · LINE 04Reduce model-change time
Verification
ProblemCauseActionsControl
01 / THE IDEAL
The factory works
as one system.
Machines, people, material and information respond to one another. Pull makes demand visible, standards stabilize the work and abnormalities trigger action where they happen.
Illustrative target stateA complete shopfloor—not a floating collection of methods.
Material moves toward the customer. Pull signals travel back to the supplying process. Each Lean method is placed exactly where it controls the work.
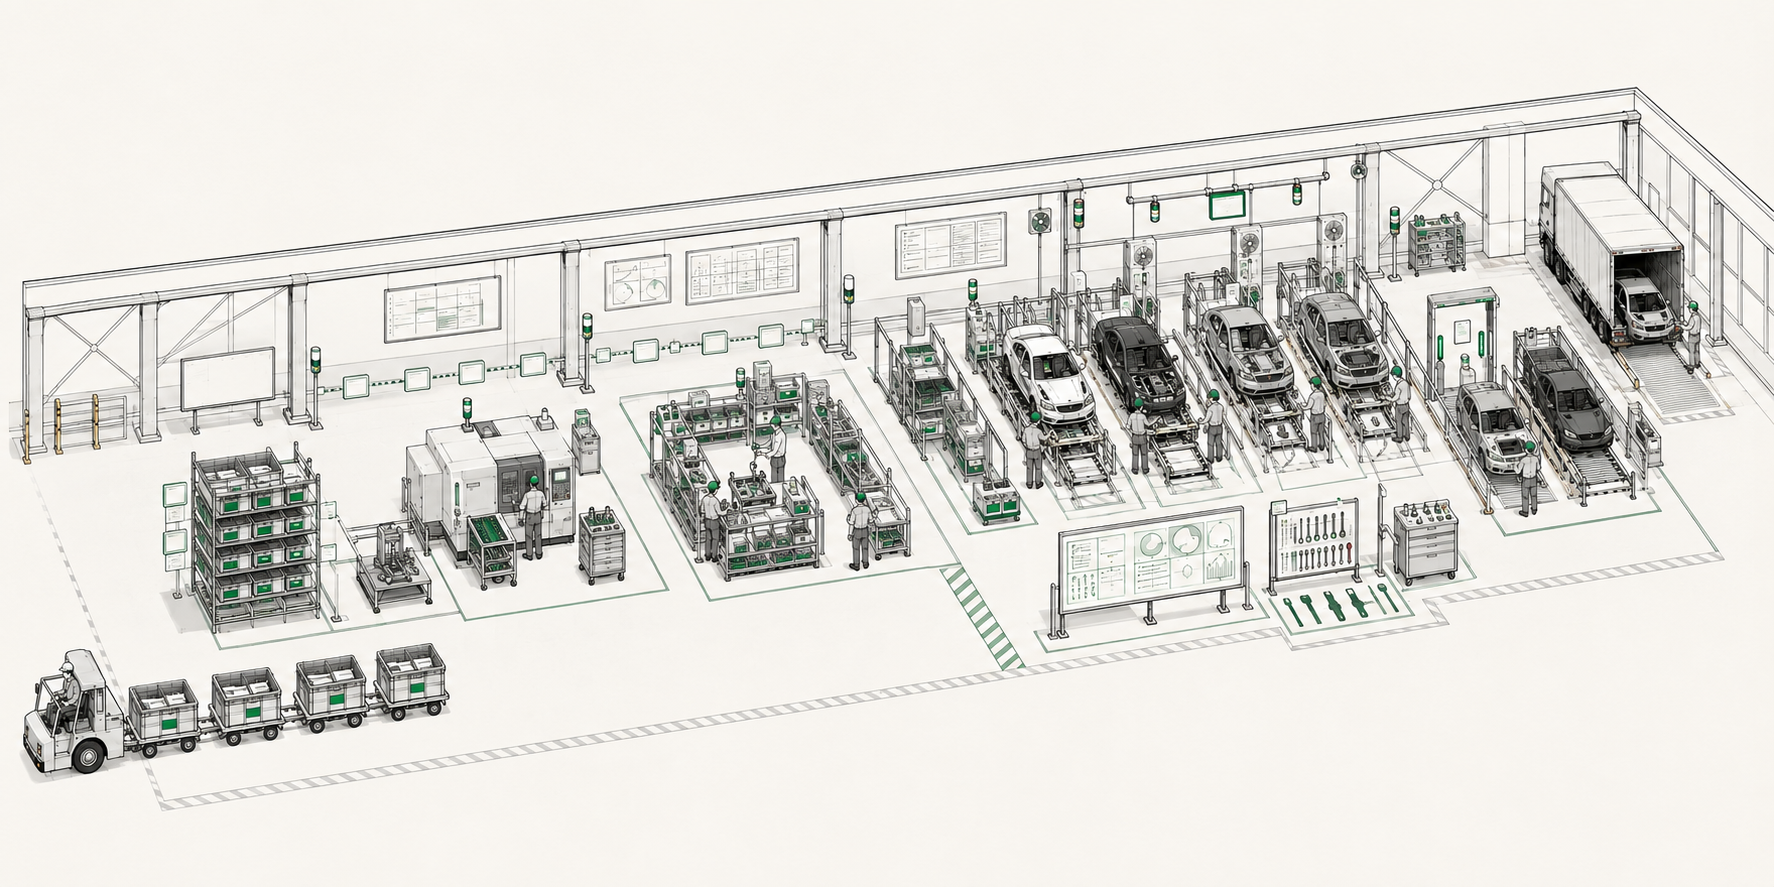
Swipe to explore the full shopfloor.
- 01SupermarketAt the material rack
- 02KanbanBetween rack and consumer
- 03SMEDDirectly at the machine
- 045S auditAt every workplace
- 05Visual managementIn the team area
- 06AndonAbove the assembly line
- 07Quality at sourceInside the process
- 08Customer pullAt shipping
02 / THE VISION
The same continuity is missing from improvement work.
On the ideal shopfloor, every container has an address and every process has a signal. In improvement work, that discipline often disappears. A model change takes 46 minutes on Line 04, yet the evidence is already split between an MES export, a workshop deck and an Excel action list.
Information is distributed across spreadsheets, slide decks, meeting notes and local folders. Every handover removes context. When a topic reaches the next workshop, the underlying assumptions, earlier decisions and even the original problem definition often have to be reconstructed.
The same pattern continues after implementation. Lessons learned stay with individuals instead of becoming reusable organizational knowledge. KPIs are recorded somewhere else, savings are documented once rather than followed over time, and teams cannot see which actions actually changed performance.
The result is not a lack of activity, but a lack of structure. Problems are analyzed repeatedly, measures are started before causes are verified and the next plant begins again from zero. Leanyx is being built to connect this chain—context, analysis, decisions, ownership, KPIs and standards—so every improvement leaves behind more than a presentation.
One case. One source of truth. A result that can be verified and reused.
03 / THE PRODUCT
One project record.
A traceable business result.
Leanyx is organized around the improvement case—not around disconnected methods. Every capability strengthens the trace from the original problem to the controlled result.
Included in the workspace
- 01Project workspace
One record for the problem, scope, team, timing and current decision.
- 02Cause and evidence
Facts, observations and the verified root cause stay attached to the case.
- 03Measures and ownership
Every action has an owner, due date, status and expected contribution.
- 04KPI and value logic
Operational change is linked to OEE, ROI, investment and realized value.
- 05Control and knowledge
Results are verified over time and converted into reusable standards.
Core principle
No isolated action list. Every decision remains connected to evidence, ownership and impact.CASE 014 · PLANT SOUTH · LINE 04
Reduce model-change time
Verification
Problem definedCause verifiedActions implementedResult in control
Verified root cause
Setup steps follow a variable sequence and tool staging begins only after the line stops.
- Owner
- Process Engineering
- Due date
- 26 Sep 2026
- Control period
- 12 weeks
- Resulting standard
- S-042
Measures
3 of 3 owned04 / VALUE CHECK
Make the impact
transparent.
Use OEE for the operational effect or ROI for the financial case. The assumptions remain visible, so a savings figure can be challenged and verified.
Measurement logic / Case 014
Case 014 / OEE
Translate 62 → 67% OEE into economic value.
Start with the line's current production value, then apply the relative OEE uplift and monetizable share.Overall equipment effectiveness62% → 67%
+5 percentage points
Monetizable OEE value
€1,209,677
per year
- Gross capacity opportunity
- €4,032,258
- Monetizable share
- 30%
- Value per OEE point
- €241,935
- Target OEE
- 67%
Calculation basisOEE = Availability × Performance × Quality. Financial value = current annual production value × (target OEE ÷ current OEE − 1) × monetizable share.
Illustrative scenario only. OEE uplift creates financial value only where additional capacity can be monetized or costs avoided. ROI depends on realized benefits and verified implementation investment.
Have a real case?Bring one improvement project into the January 2027 pilot.
Discuss this business case 05 / ROADMAP
Built step by step.
The near-term scope is deliberately narrow: prove the project workflow first, then connect portfolios, systems and knowledge across plants.
01
Q4 2026
Foundation
In development
- Project dashboard
- Structured case record
- OEE and ROI calculator
02
Jan 2027
Pilot
Planned
- First pilot environment
- Selected problem-solving workflows
- Structured user feedback
03
2027
Connect
Product direction
- Improvement portfolio
- Operational KPI connections
- Knowledge and standards
04
Vision
Scale
Long term
- Cross-plant learning
- Benchmarking
- Plant maturity view
Foundation and pilot scope are actively planned. Connect and Scale describe product direction, not committed release dates.
06 / PILOT ACCESS
Planned for January 2027
Start with one real improvement project.
The pilot is for Lean, Continuous Improvement, Operational Excellence and plant teams that want to make one manufacturing case traceable from the first signal to verified impact.
- Structured problem record with evidence and a verified cause
- Owned actions with dates, status and expected contribution
- Operational KPI and financial value logic using OEE or ROI
- Control period, result verification and reusable standard
Pilot inquiry
Tell us where the improvement chain currently breaks. We will reply personally about fit and next steps.